When planning a project, one question always comes up: Will this site flood? The answer is not always simple. A flood elevation survey shows how a property sits compared to the base flood level, but that’s only part of the story. Real-world problems often go beyond the official maps. That’s where Chicago’s 311 data comes in. By combining survey results with actual flood complaints from neighbors, you get a sharper picture of the risks and can make better decisions before breaking ground.
Why Elevation Alone Isn’t Enough
Flood maps are important, but they can’t capture every problem. They outline broad zones, yet Chicago has unique challenges. Heavy rains, aging sewer systems, and flat terrain often cause flooding outside of those mapped areas.
Think of it this way: flood maps are like a weather forecast, but they don’t always show the potholes on your block. Chicago’s 311 flood complaints—labeled as “Water in Basement” reports—fill that gap. They show where residents already deal with flooding, block by block.
When you bring these two sources together, you move from guessing to knowing. That’s the edge developers, engineers, and property owners need when planning in flood-prone neighborhoods.
Step 1: Gather Your Data
First, you need the right information in hand.
- Flood Elevation Survey: This is the baseline. It tells you the property’s benchmark elevations compared to the base flood level. Without it, you’re only working with estimates.
- 311 Flood Complaint Data: Reports of water in basements, street flooding, or drainage backups.
- Flood Maps: Official maps that outline flood hazard areas and base flood elevations.
- City Guidance: Information programs that explain how the city responds to flood-related issues.
With these layers, you’re ready to build a complete view of flood risk.
Step 2: Overlay in QGIS
Here’s where it gets practical. A free program called QGIS lets you overlay all this data on one map. Even if you’re not a GIS expert, the process is straightforward.
- Start by setting the project coordinate system to Illinois State Plane East.
- Import the flood elevation survey points for your site.
- Add the flood map layer to see official zones.
- Bring in the 311 complaint data.
- Run a simple spatial join to see how many complaints fall within 250–500 feet of your property boundary.
With just these steps, you can spot patterns fast. For example, if your survey shows the property just above the base flood level but the 311 data shows repeated flooding nearby, you’ll know to plan with caution.
Step 3: Turn It into a Clear Risk Map

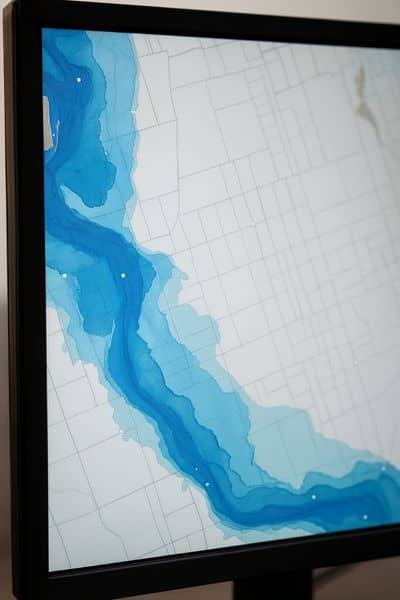
The technical side is helpful, but clients, investors, and even city officials appreciate visuals. A one-page map can go a long way in making your case.
Your map should highlight three things:
- Flood zones with shading for easy recognition.
- Surveyed property boundaries and benchmarks, so the exact site is clear.
- 311 complaints as points or a heatmap, showing the density of real-world issues.
This kind of map doesn’t just show risks—it builds trust. Clients and partners see that you’re not relying on guesswork. When an experienced land surveying company creates these maps, they combine official survey data with real neighborhood flood reports, turning raw information into insights that drive better planning decisions.
What This Means in the Field
Flood data isn’t just for office reports. It changes how surveyors and construction crews work on-site.
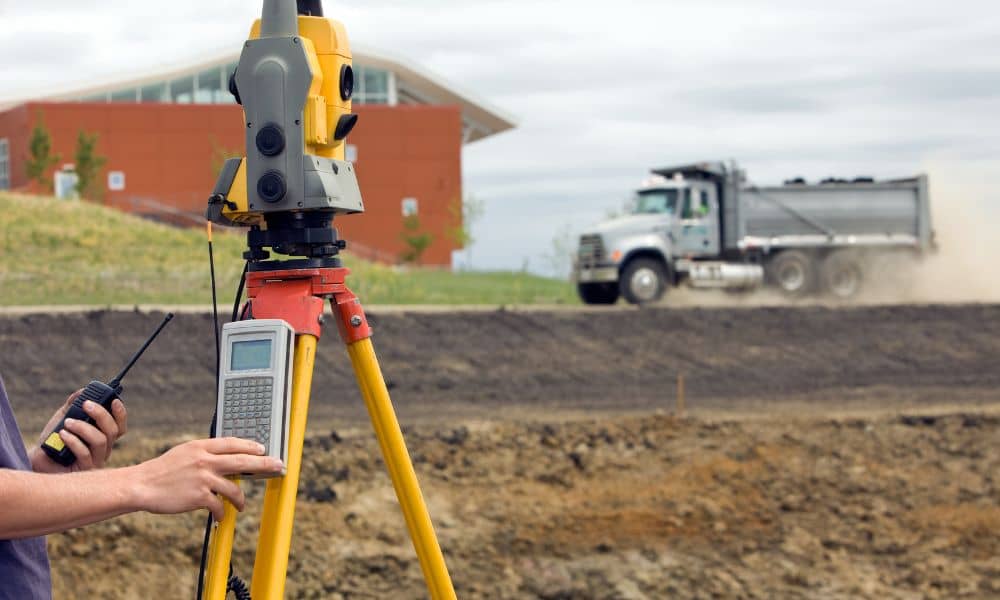
For example, knowing an area has frequent water in basements helps crews pick safer instrument setups. It warns them about utility vaults or manholes that might be flooded. It also allows project managers to schedule extra time when working on saturated soils.
By preparing this way, you reduce delays, protect equipment, and keep crews safe. That’s a big win before the first stake goes in the ground.
Why Developers and Owners Should Care
For developers, time and money are everything. A flood elevation survey paired with 311 data is a low-cost way to avoid expensive surprises later.
- Due diligence: Before buying land, you’ll know if hidden drainage problems exist.
- Design choices: Architects and engineers can plan smarter drainage systems if they see complaint clusters nearby.
- Permitting: City reviewers respond well to applicants who bring thorough, data-backed evidence of risk planning.
Even property owners benefit. If you’re considering building an addition or investing in a multifamily property, these insights help you ask the right questions before signing contracts.
Bonus: Keep Tracking with Live Data
Flooding is not a one-time problem. The city updates its 311 data regularly, so you can keep watching patterns long after your survey is complete. Sharing this tool with clients shows them you care about their property beyond the survey date.
It also creates opportunities for ongoing services. For example, future subdivision surveys or topographic surveys can incorporate new complaint trends, keeping site plans fresh and relevant.
Conclusion
Flood risk is complicated, but that doesn’t mean you have to guess. Flood elevation surveys give you the official numbers, while 311 complaint data shows the lived experience of residents. Together, they create a powerful planning tool.
For surveyors, this means safer crews and smoother projects. For developers and property owners, it means fewer surprises, smarter investments, and stronger relationships with city agencies.
In short, it’s not just about maps or numbers. It’s about planning with confidence in a city where water is always part of the equation.
So before your next project, ask for more than a standard survey. Ask for a flood elevation survey backed by real 311 data. It’s the smartest step you can take to build safely, save money, and protect your investment.